
Use HertzBeat to monitor the Internet of Things database IoTDB, and it will be done in 5 minutes!
Introduction to IoTDB
Apache IoTDB (Internet of Things Database) is a time-series database management system that can provide users with data collection, storage and analysis services. Due to its lightweight architecture, high performance and high availability, and seamless integration with Hadoop and Spark ecosystems, IoTDB meets the requirements of massive data storage, high-throughput data writing, and complex data query and analysis in the industrial IoT field. need.
Introduction to HertzBeat
HertzBeat is an open source, easy-to-use and friendly real-time monitoring system that does not require Agent and has powerful custom monitoring capabilities. Supports monitoring of application services, databases, operating systems, middleware, cloud native, etc., threshold alarms, and alarm notifications (email WeChat Dingding Feishu). HertzBeat's powerful customization, multi-type support, easy expansion, and low coupling hope to help developers and small and medium teams quickly build their own monitoring systems.
Get monitoring IoTDB in HertzBeat in 5 minutes
Prerequisites, you already have IoTDB environment and HertzBeat environment.
1. Enable the metrics function on the IoTDB side, which will provide interface data in the form of prometheus metrics.
- The metric collection is disabled by default, you need to modify the parameters in
conf/iotdb-metric.ymlfirst, then restart the server
# Whether to start the monitoring module, the default is false
enableMetric: true

# Data provision method, externally provide metrics data through jmx and prometheus protocol, optional parameters: [JMX, PROMETHEUS, IOTDB], IOTDB is closed by default.
metricReporterList:
   - JMX
   - PROMETHEUS
- Restart IoTDB, open a browser or use curl to access http://ip:9091/metrics, and you can see the metric data.
2. Add IoTDB monitoring on the HertzBeat monitoring page
- Click Add IoTDB Monitoring
Path: Menu -> Database Monitoring -> IoTDB Monitoring -> Add IoTDB Monitoring

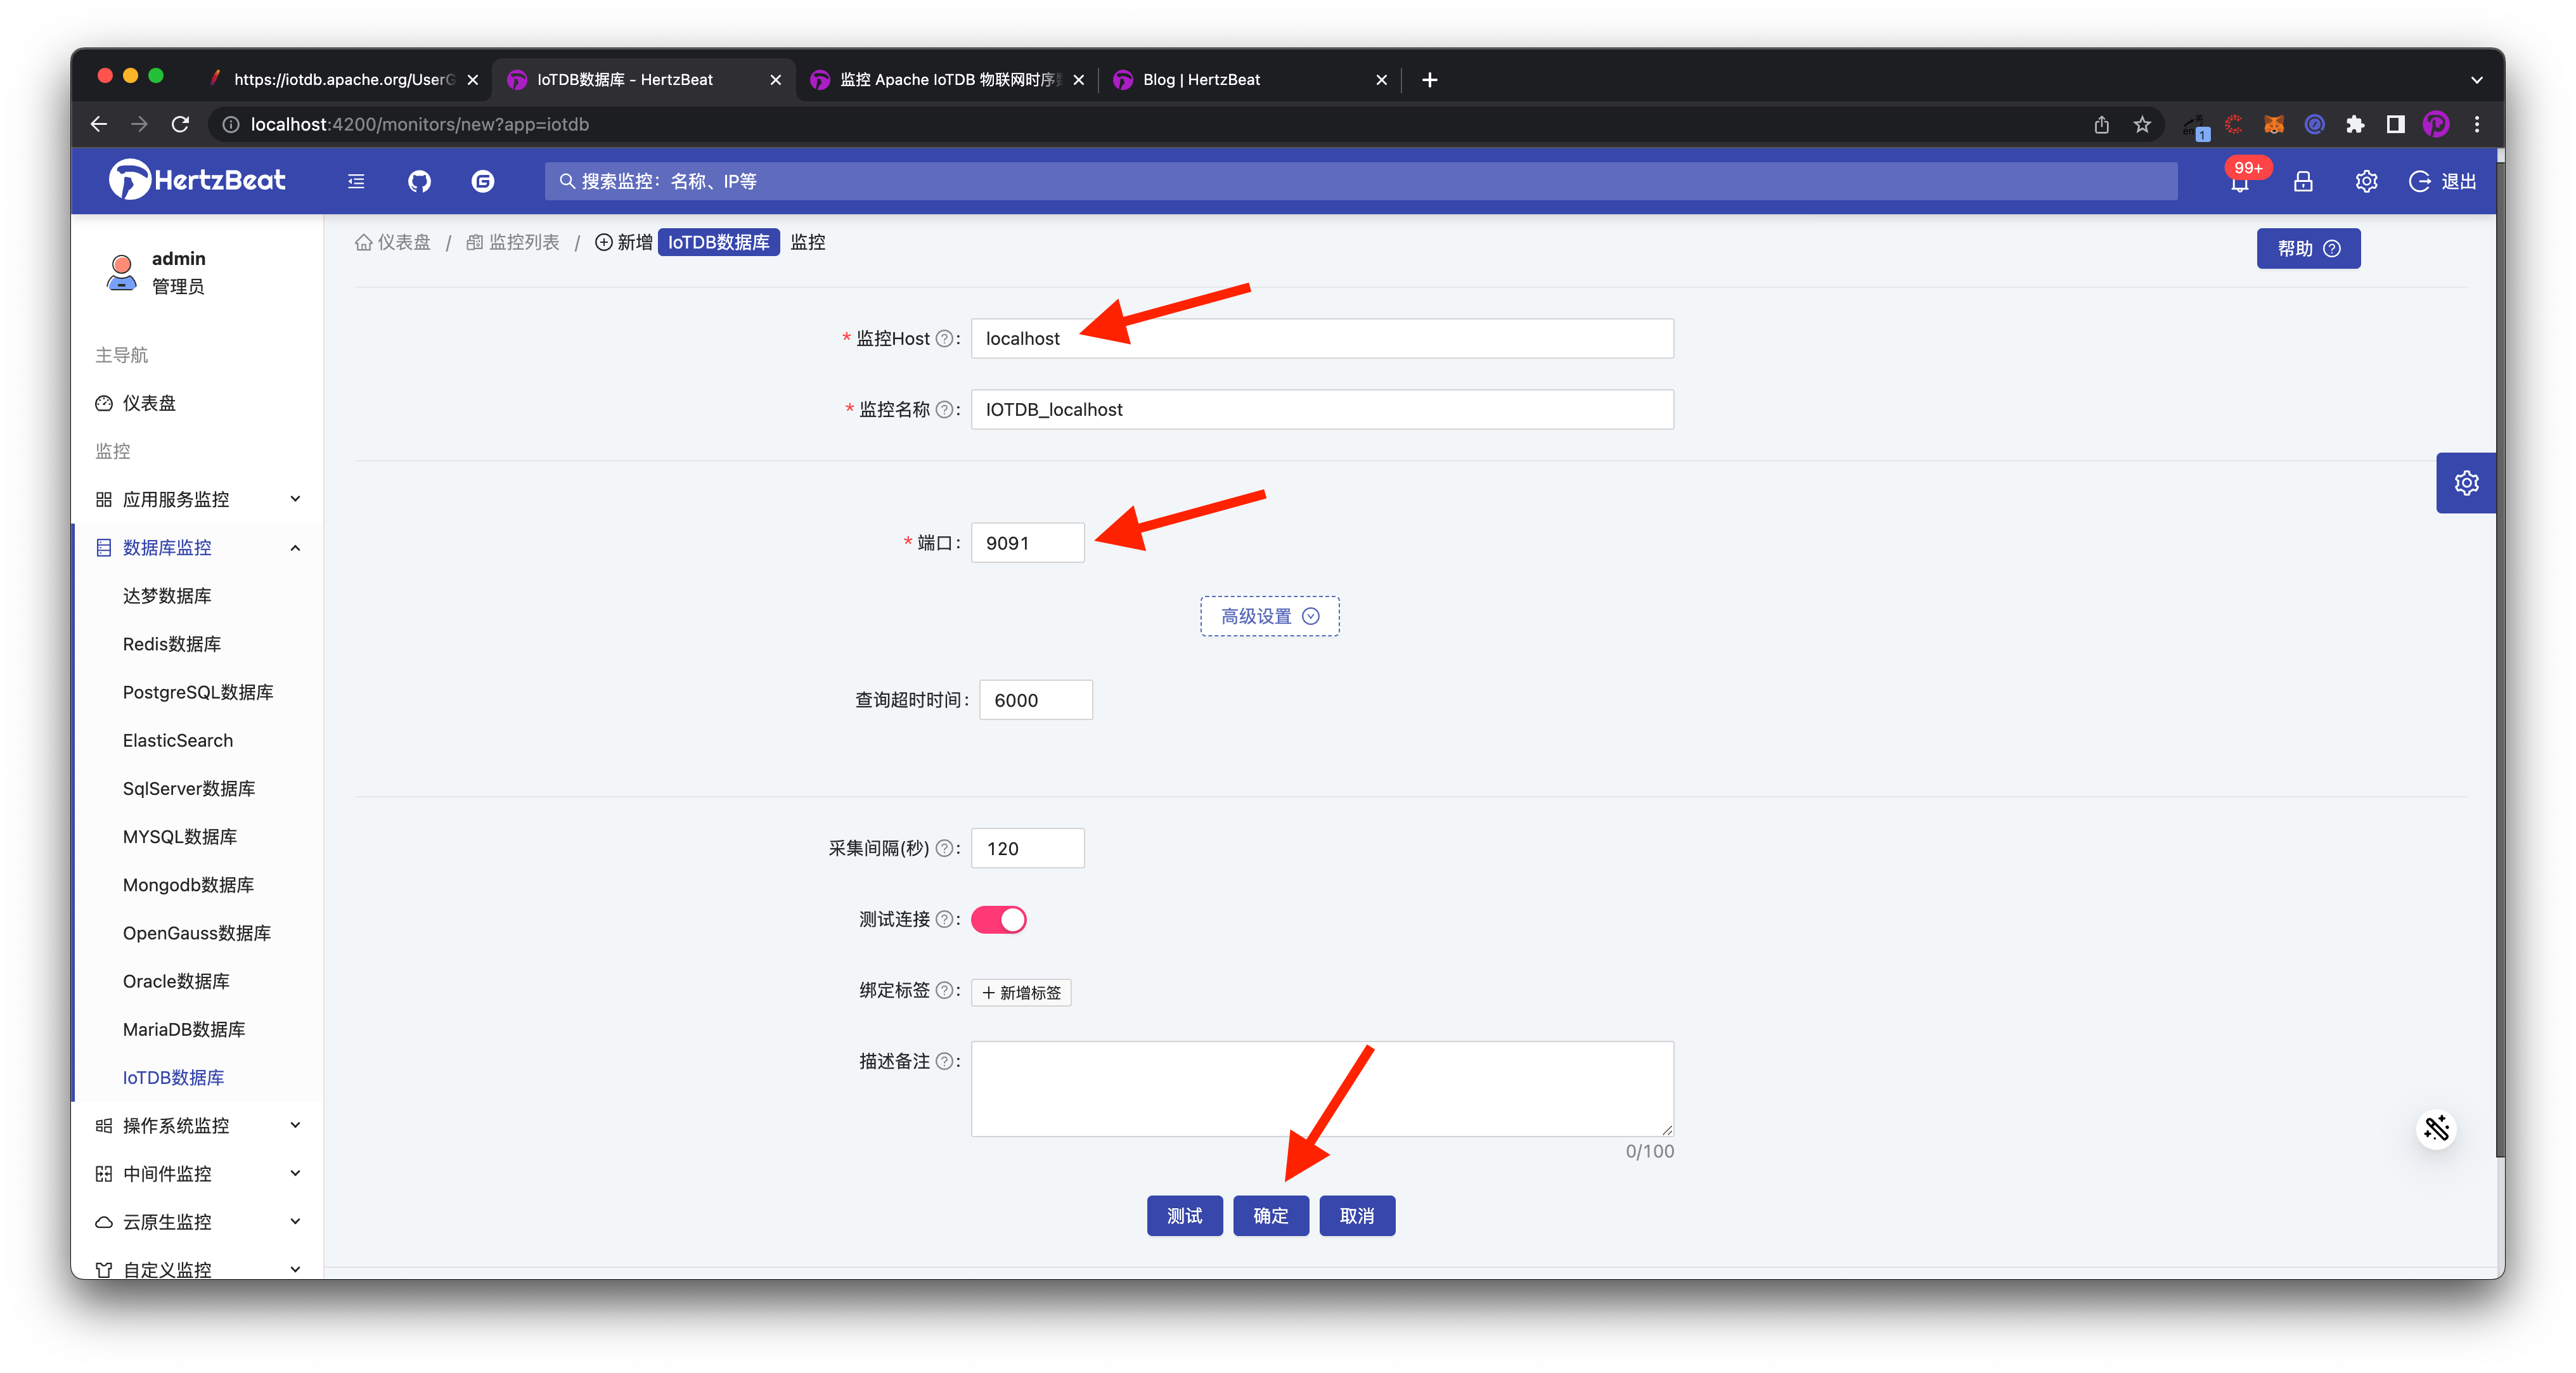
- Configure the parameters required for monitoring IoTDB
Fill in the IoTDB service IP and monitoring port (default 9091) on the monitoring page, and finally click OK to add. For other parameters such as collection interval, timeout period, etc., please refer to Help Documentation https://hertzbeat.com/docs/help /iotdb/
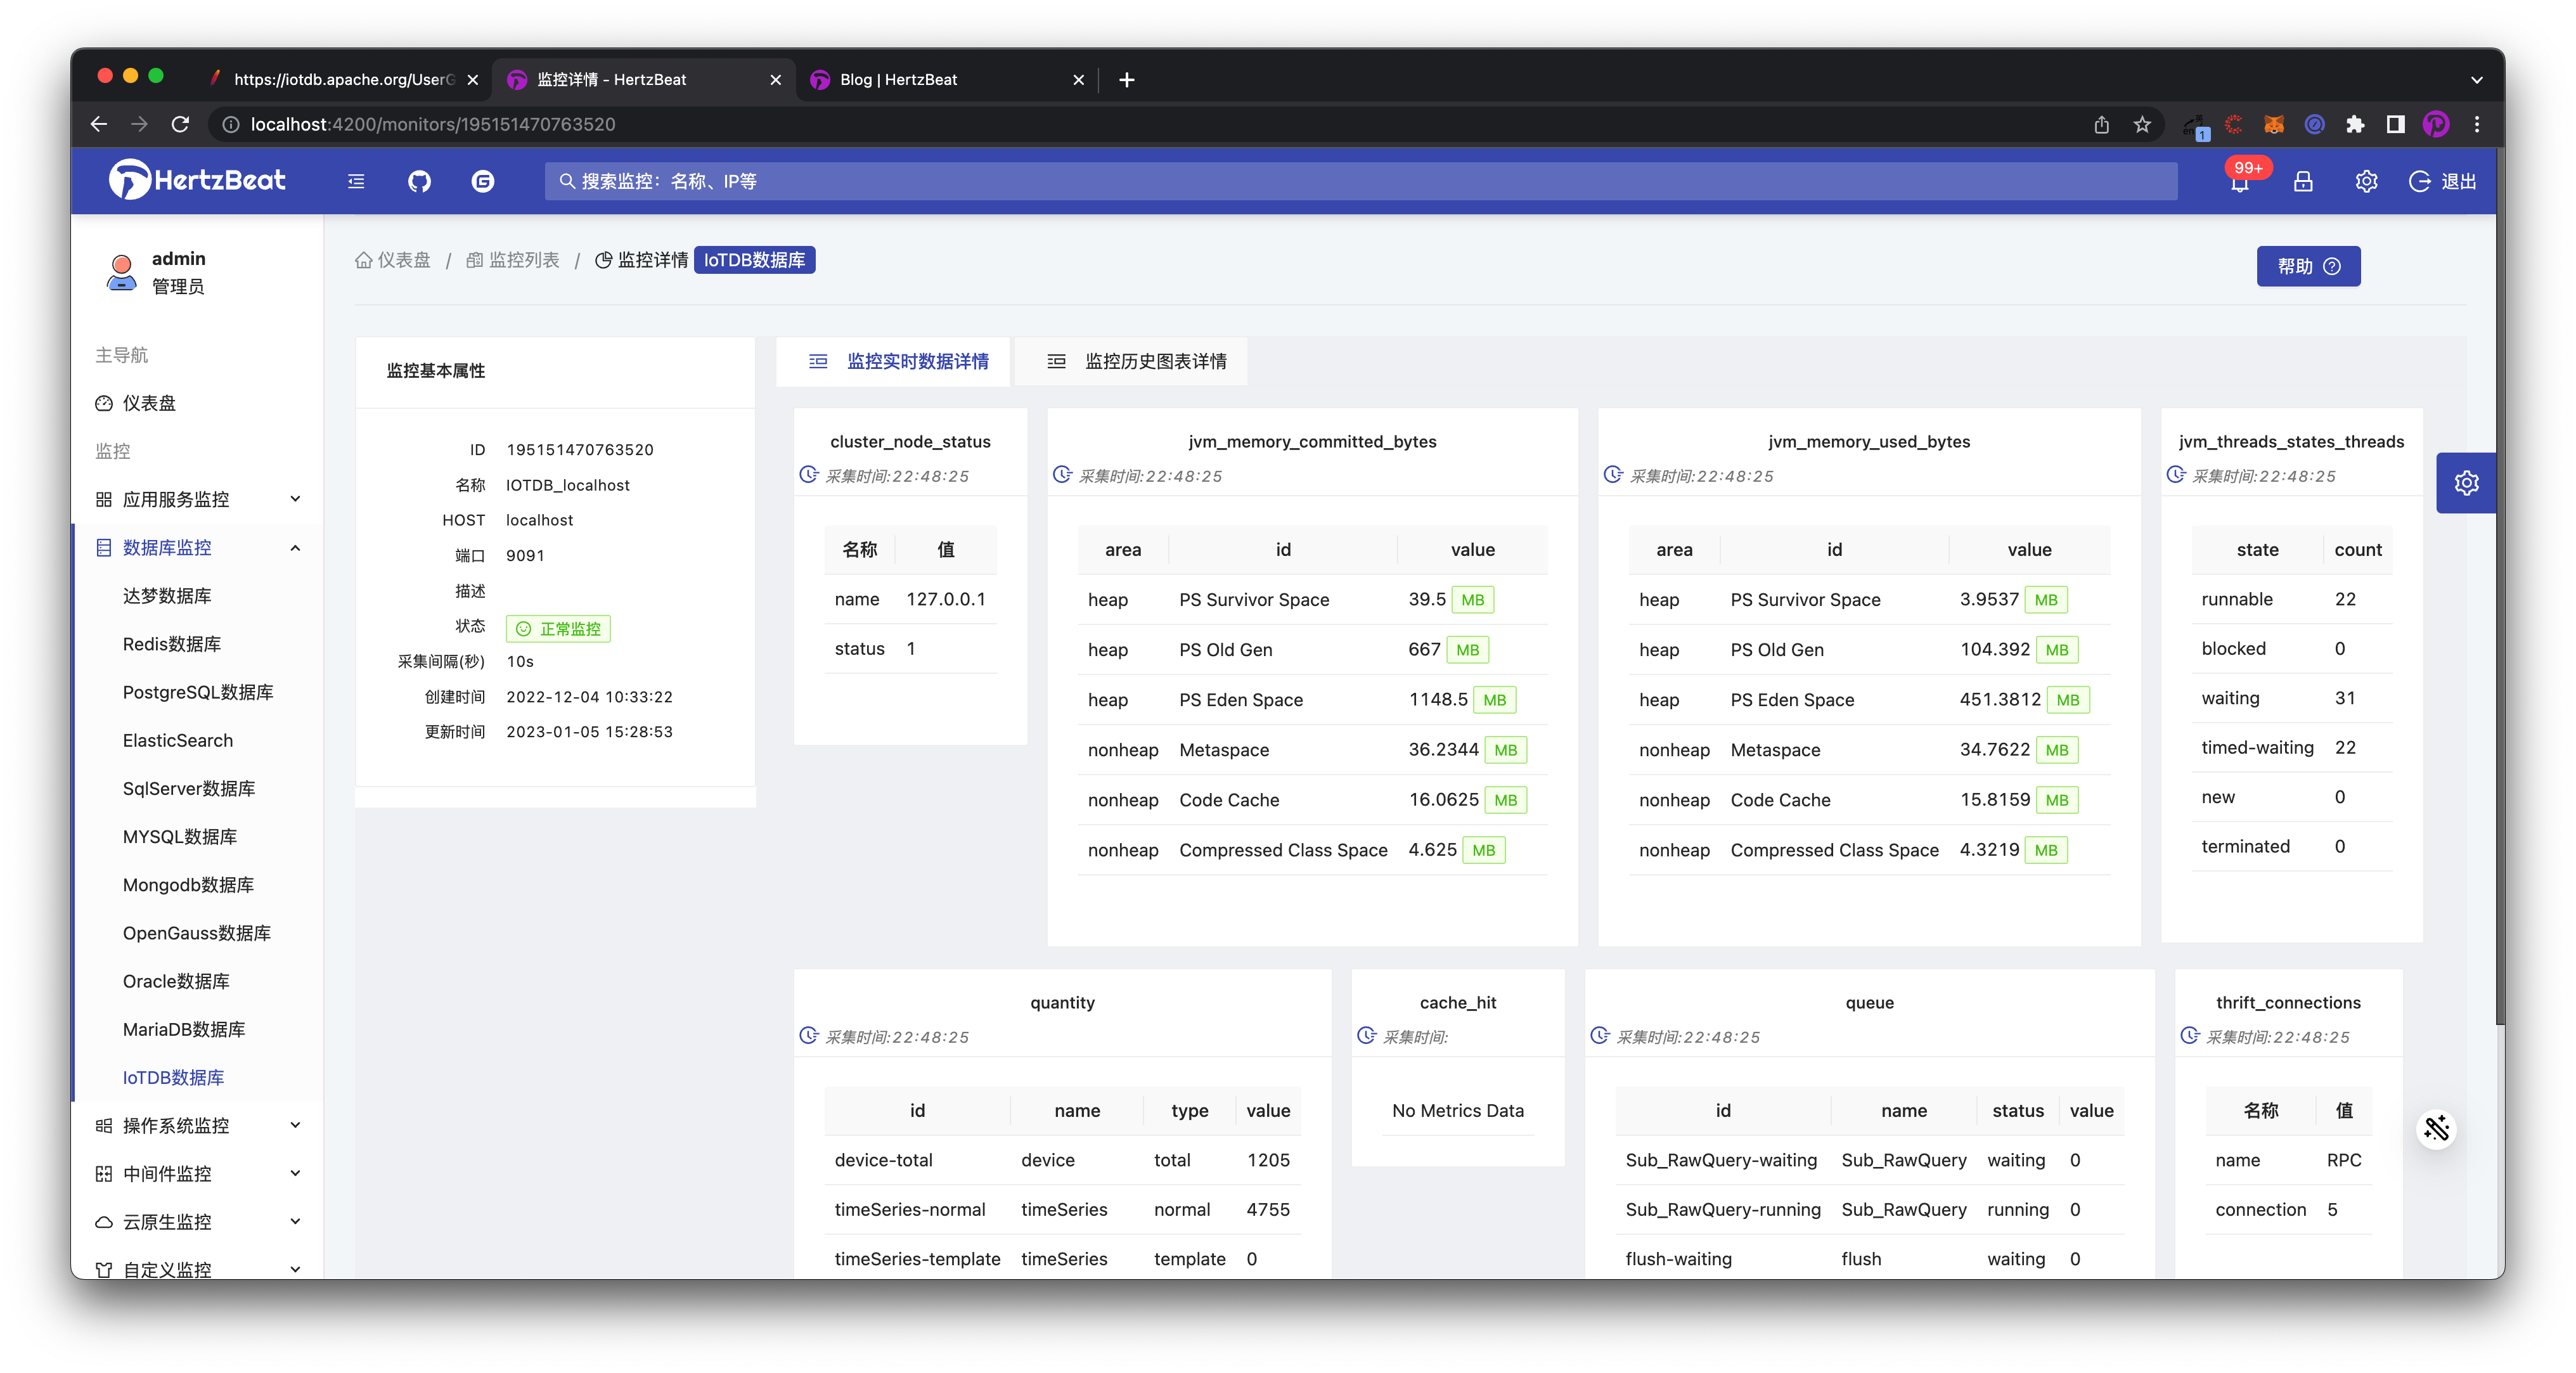
- Complete ✅, now we have added the monitoring of IoTDB, check the monitoring list to see our added items.

- Click Operation->Monitoring Details Icon of the monitoring list item to browse the real-time monitoring indicator data of IoTDB.
- Click Monitoring History Details TAB to browse IoTDB's historical monitoring indicator data chart📈.

Complete DONE! Through the above steps, it is actually two steps to sum up
- Enable
metricsfunction on IoTDB in one step - Another step is to configure the IP port on the HertzBeat monitoring page to add monitoring
In this way, we have completed the monitoring of IoTDB. We can view the monitoring details and indicators at any time to observe its service status, but people cannot always watch it. When there is always a time to rest, monitoring is often accompanied by alarms. When monitoring When the indicators are abnormal, the monitoring system needs to be able to notify the person in charge in time
Next, we will teach you step by step to configure the threshold alarm notification in the HertzBeat system
3. Add IoTDB indicator threshold alarm in HertzBeat system
- Configure a threshold alarm for an important indicator
Path: Menu -> Alarm Threshold -> Add Threshold
- Select the configured indicator object. IotDB monitors many indicators, one of which is related to the status of the node
cluster_node_status->status(node status, 1=online 2=offline). - Here we configure to send an alarm when the indicator
status==2, the alarm level is Critical Alarm, which is triggered once, as shown in the figure below.

- Add message notification recipients
Path: Menu -> Alarm Notification -> Alarm Recipient -> Add New Recipient
Message notification methods support email, DingTalk, WeChat Work, Feishu, WebHook, SMS, etc. Here we take the commonly used DingTalk as an example.
- Refer to this Help Documentation https://hertzbeat.com/docs/help/alert_dingtalk to configure the robot on DingTalk and set the security custom keyword
HertzBeat, get the correspondingaccess_tokenvalue. - Configure the receiver parameters in HertzBeat as follows.
【Alarm Notification】->【New Recipient】->【Select DingTalk Robot Notification Method】->【Set DingTalk Robot ACCESS_TOKEN】->【OK】

- Configure the associated alarm notification strategy ⚠️ [Add notification strategy] -> [Associate the recipient just set] -> [OK]

Finished, now wait for the warning message to come. ding ding ding ding
[HertzBeat warning notification]
Alarm target object: iotdb.cluster_node_status.status
Affiliated monitoring ID: 205540620349696
Belonging monitoring name: IOTDB_localhost
Alarm level: critical alarm
Alarm trigger time: 2023-01-05 22:17:06
Content details: The status of IOTDB node 127.0.0.1 is monitored as OFFLINE, please deal with it in time.
Summary
This practical article took us to experience that if HertzBeat is used to monitor the IoTDB database indicator data, we can find that HertzBeat, which integrates monitoring-alarm-notification, is more convenient in operation and use, and IoTDB can be included in the monitoring with a simple click on the page , it is no longer necessary to deploy multiple components and write multiple YML configuration files with thresholds.
IoTDB Github: https://github.com/apache/iotdb HertzBeat Github: https://github.com/dromara/hertzbeat
Welcome to learn about using Star Support!
Only one docker command is needed to install and experience heartbeat:
docker run -d -p 1157:1157 --name hertzbeat tancloud/hertzbeat
Note ⚠️HertzBeat v1.2.3 version supports IoTDB v0.12 v0.13. Since its v1.0 has just been released, all indicators of this version are not yet compatible.